
Rust Profiling with Instruments and FlameGraph on OSX: CPU/Time
UPDATE APRIL 2017
I just tried to follow my own directions and found out that Instruments no longer lets you export CSV data that the Time Profiler collects (I’m currently using Instruments Version 8.3 (8E162)). I’m leaving the rest of the post as-is in case it’s useful to anyone still on an older version of Instruments, but any point after the export won’t work, so no pretty flame graphs anymore :( There’s still analysis of performance you can do within Instruments.
Original Post
I recently decided I wanted to figure out a way to measure the performance of the Rust code I’ve been writing and see pretty graphs of what parts of the code were slower. There are a bunch of different ways to do this, and I was going to cover more than one of them, but I am le tired so I decided to post this after writing only about Instruments + FlameGraph.
My somewhat-arbitrary constraints used in picking this method of profiling and graphing:
- Profile Rust programs’ time (I’d like to profile memory usage too, but that’ll be in another post)
- In a way that produces graphs
- On OSX (Linux has other, some may say better, options, but for getting a first look at the performance of my code at all, I don’t feel like booting a VM)
If these constraints are the same as yours, great! Read on! However, there are many more tools that didn’t meet these constraints (or that I didn’t find), so I encourage you to do research specific to your situation as well.
Prerequisites
For any profiling of Rust code on OSX, it’s recommended to do the following:
- Build with
cargo build --releasethen run./target/release/[binary]; or usecargo run --release- Forgetting to build in release mode (which turns on optimizations) is the #1 cause of unexpected Rust slowness.
- By default, cargo builds in debug mode, which is faster to compile but runs more slowly.
- We want to profile the optimized code.
- Turn on debug symbols in your release profile in Cargo.toml
- This lets the profiling tools match up to your source code.
-
As documented on crates.io, this is done by adding this to your
Cargo.toml:[profile.release] debug = true
- Use OSX’s system allocator instead of jemalloc
- This requires using nightly Rust.
- I’m not going to pretend to understand this, but it seems like valgrind might not report allocations correctly with jemalloc? It didn’t seem to hurt anything, but I’m not sure how important this is.
- More discussion on /r/rust about the impact of this on benchmarks.
-
As documented in the book, this is done by adding this code to your crate:
#![feature(alloc_system)]
extern crate alloc_system;
Protip on inlining
I had to consult with Jake Goulding on this one– I was profiling some code that had a function calling another function, and only the inner function was showing up. I couldn’t figure out why. Jake quickly looked at what I was doing and guessed correctly that the compiler was inlining the contents of the outer function as an optimization, so it effectively didn’t exist anymore.
Jake taught me about adding the annotation #[inline(never)] before the outer function, which will tell the compiler to not inline it so that I could see the profiling for it.
Instruments
Instruments is a part of XCode. You’ve already downloaded 2 gigs of XCode, right?
- Open XCode. Don’t pick anything on the splash screen.
- From the XCode menu, choose “Open Developer Tool” -> “Instruments”.
- Choose a blank profiling template. (Or try others! I haven’t explored all the options yet)
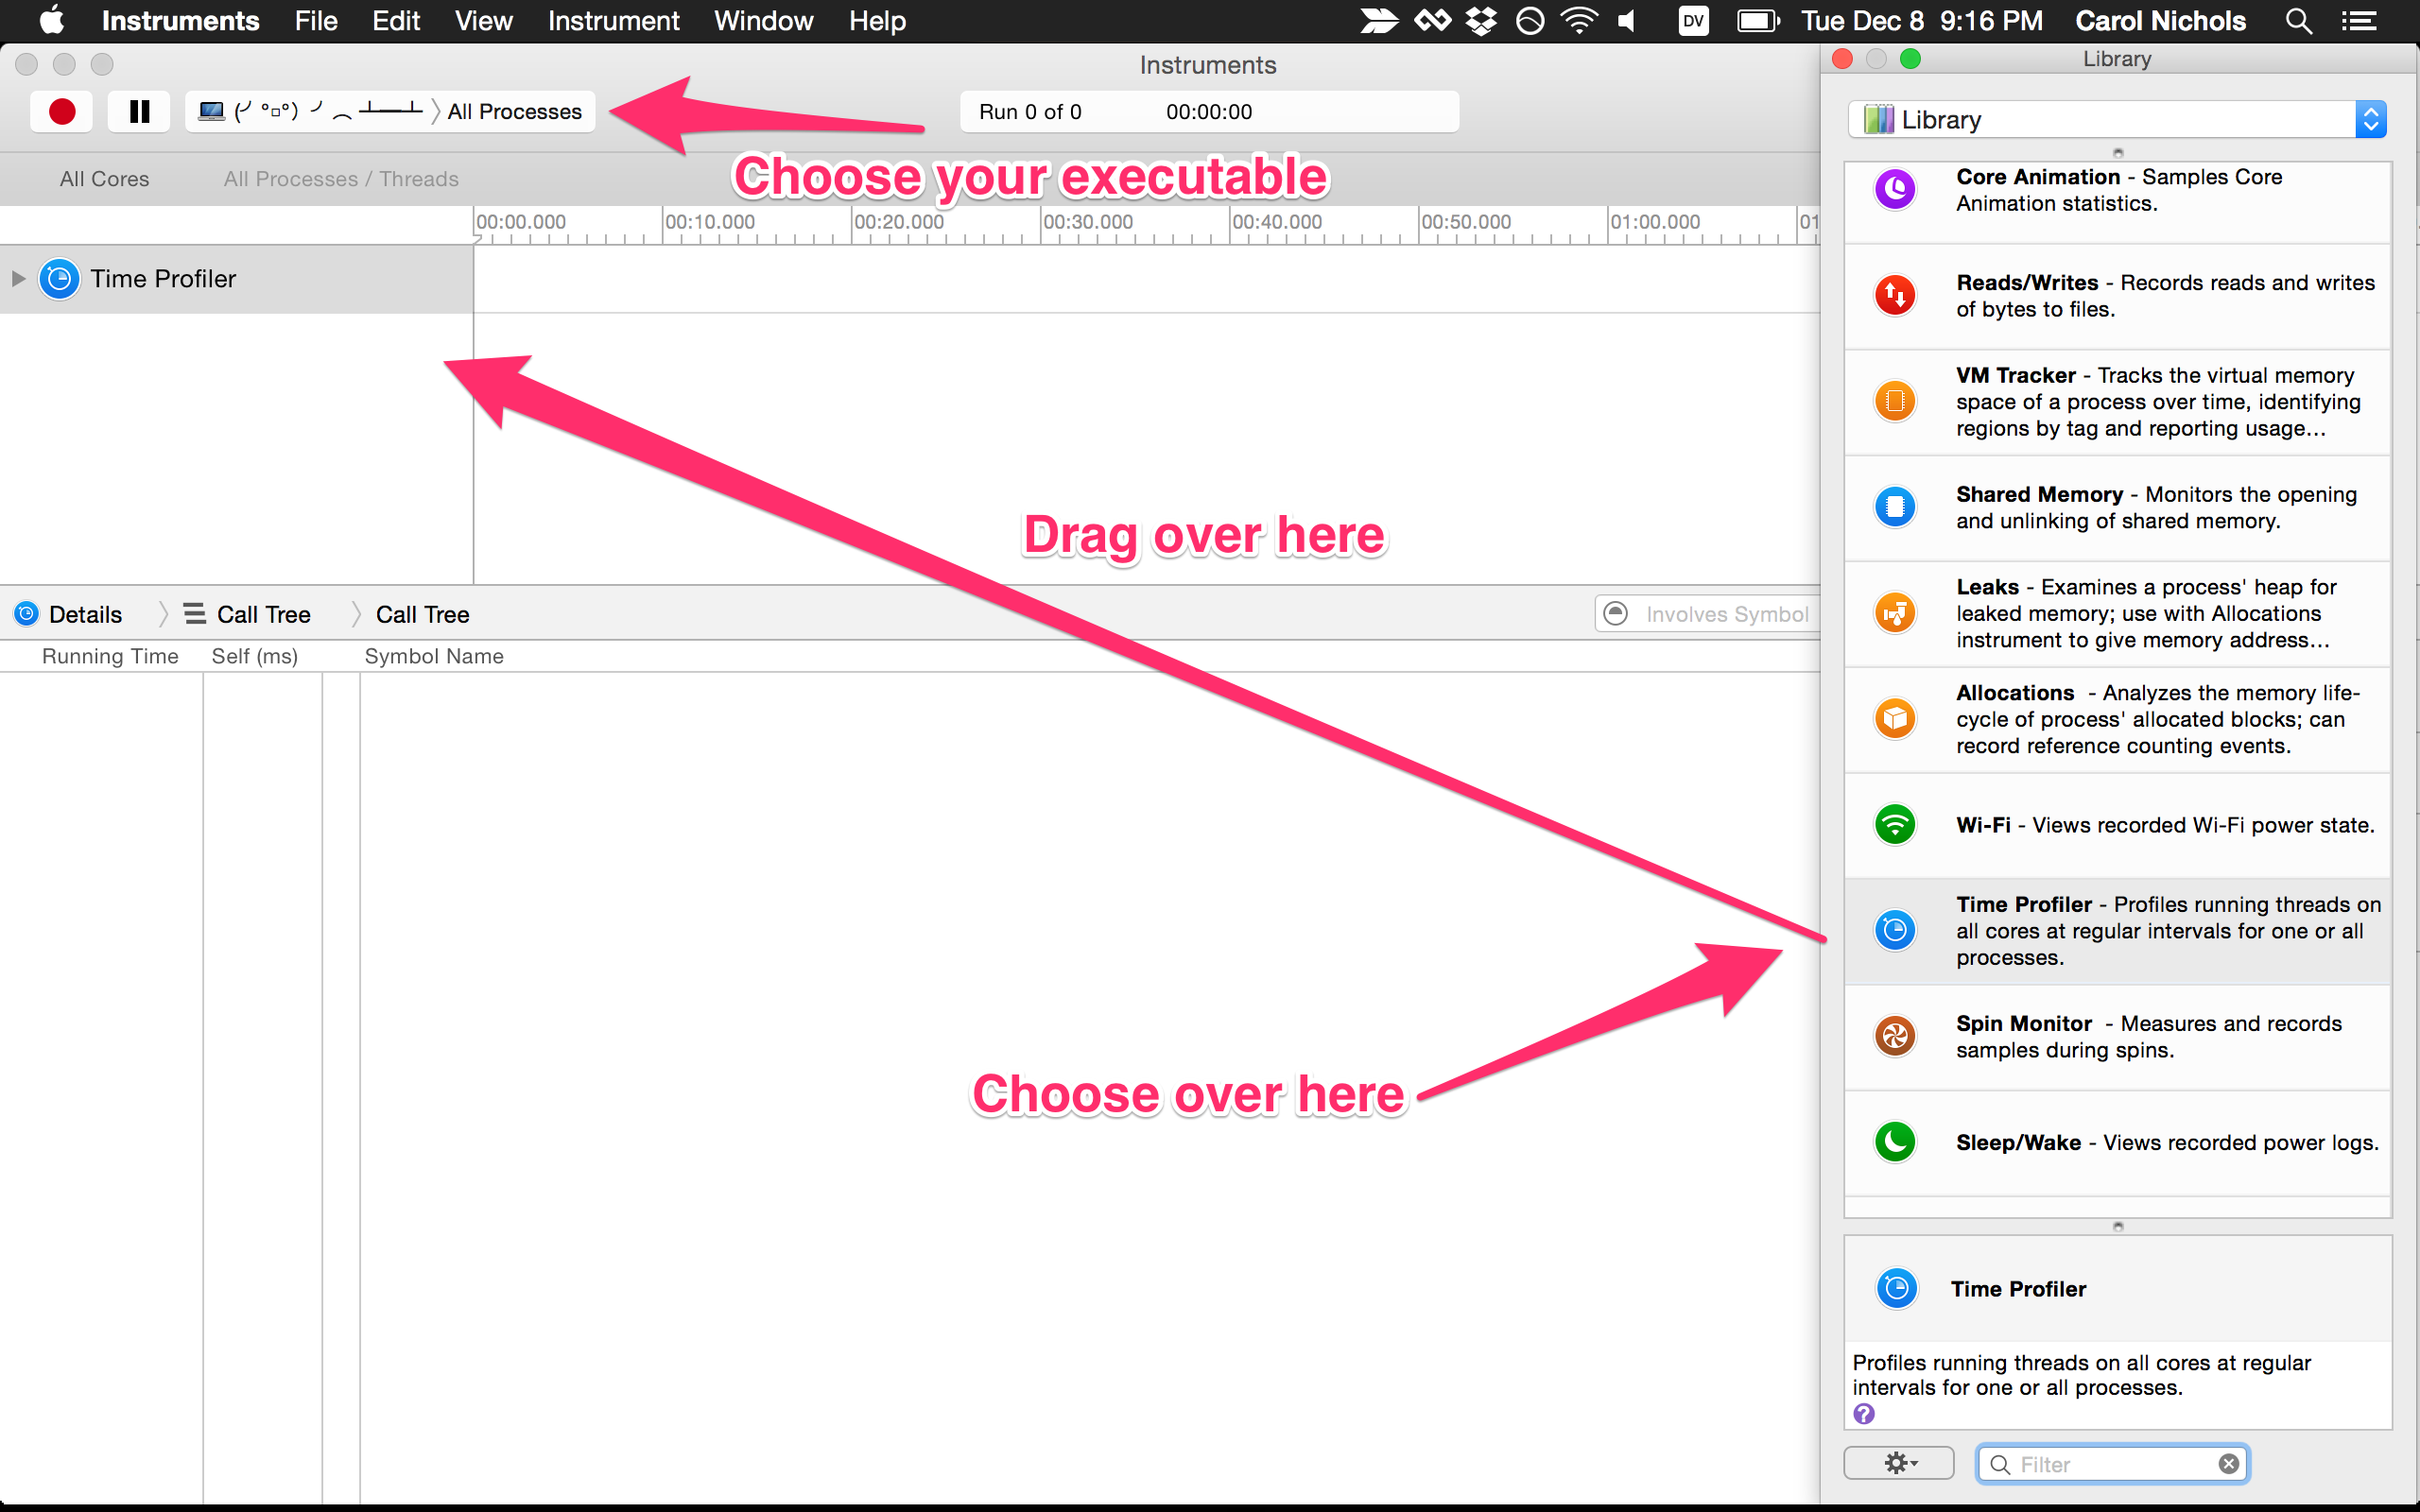
- Click the “+” button in the upper right. Choose “Time Profiler” and drag it to the section in the upper left.
- In the upper left, after your computer name (yes, my computer’s name is the tableflip emoji), click on where it says “All processes” and click on “Choose Target” in order to choose just your executable instead of all processes. For some reason, populating the list of executables to choose from takes a long time, so don’t be alarmed.
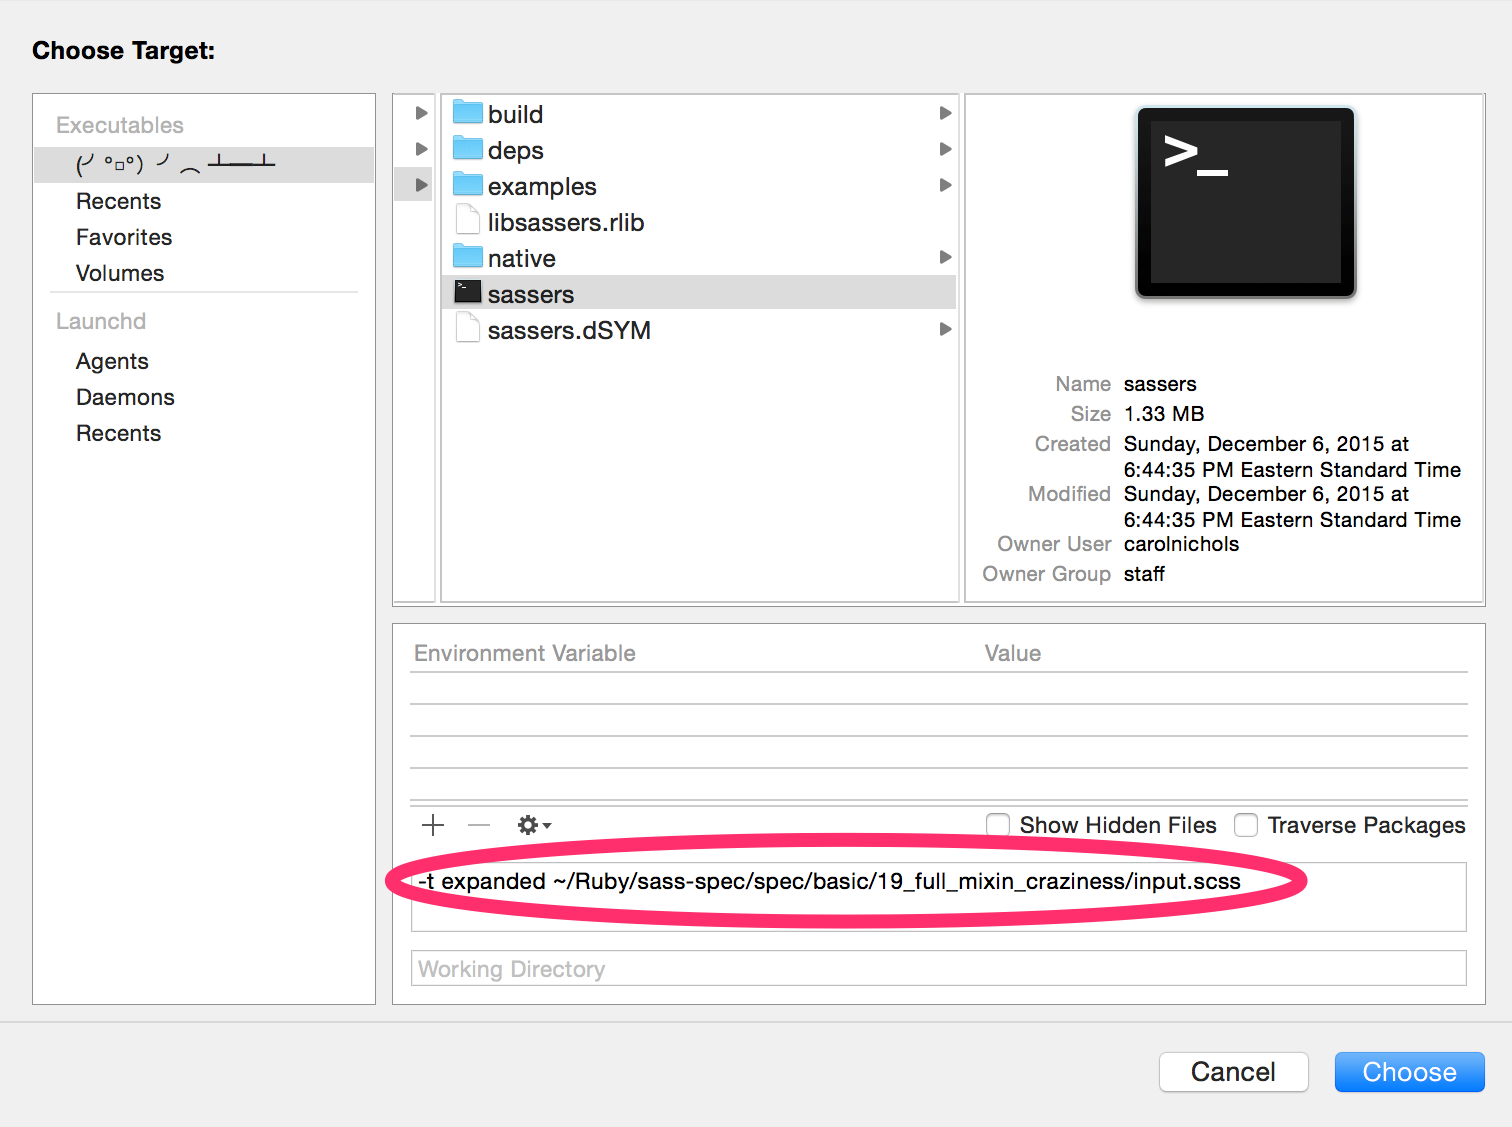
- If needed, you can type environment variables and arguments into the “Choose Target” window. Here’s an example where I added some arguments:
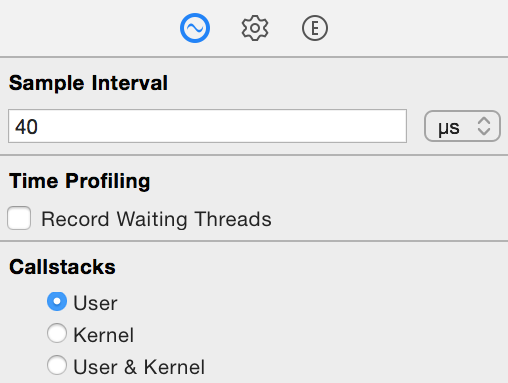
- By default, the Time Profiler takes a sample every 1 ms. Because I was using a toy example, I found that I wasn’t getting interesting results because my code wasn’t being sampled very often, so I changed the sample interval from 1 ms to 40 microseconds in the lower right.
- Click the record button in the upper left and wait for it to run your code. You may need to give administrator privileges to Instruments. You’ll know it’s done when the button changes back to a record button after being a stop button.
- You do get a little bit of a graph across the top– From the View menu, choosing “Snap Track to Fit” makes it a little easier to see. It still doesn’t show very specific information though.
Flamegraph
Flamegraph is an awesome collection of perl scripts that can take the output of a few different profiling tools and produce a lovely SVG.
- To get the data out of Instruments for Flamegraph to use, I followed these instructions which say to:
- Expand all the nodes in the call tree: Option-click on all the roots to toggle them open
- From the Instrument menu, choose “Export track” and save the CSV.
-
Download the FlameGraph code and run:
$ ./stackcollapse-instruments.pl export.csv | ./flamegraph.pl > pretty-graph.svg - Open the resulting svg in your browser. You now have a pretty graph!!
Here’s an SVG I made from the toy code in this repo.
Happy profiling!!!